$QQQ vs $IWM: Historical Spread Visited
Mean reversion ahead?
$QQQ vs $IWM: Historical Spread Visited
Is there a mean reversion trade coming?
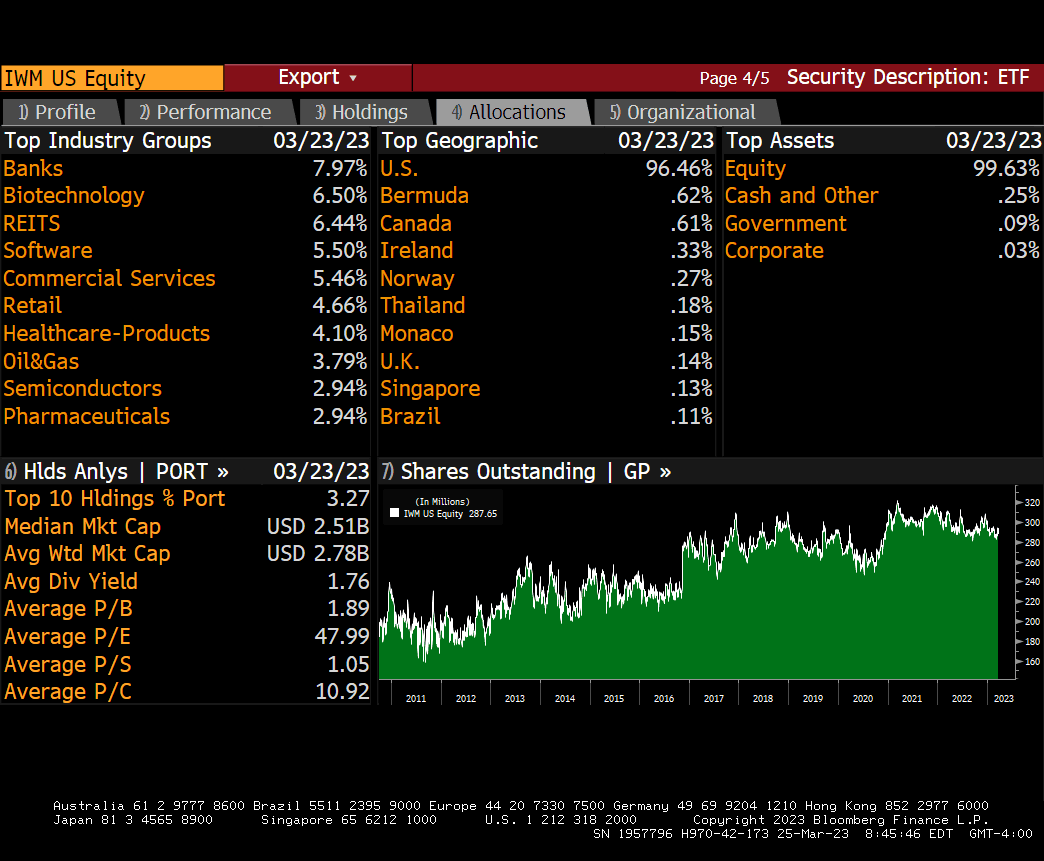
Many have asked and wondered how the market will resolve the dramatic difference in performance between the QQQ and IWM of late. Will the IWM rally back as the bank crisis resolves? Will the QQQ finally give in to selling while the IWM stabilizes, narrowing the differential? If the $IWM rallies back, will this cause a rotation out of the “safety” that mega-caps have been bestowed of late? Well, let’s take a look at the historical spread between the two indexes. First, many investors think of the IWM as a small cap index, yet look at its composition below. It is banks (8%), biotech (7%) and even software stocks (6%), albeit smaller in nature but not exactly small! For example, TXRH has a $7 billion market cap and is a top holding while CROX is nearly the same size. The $QQQ is 40-50% mega caps, period.
Now that we have a foundation for what we are shooting against, let’s look at the historical spread. You can see in the top chart (below) that the indexes mostly track each other and have a high correlation until, they don’t! We choose the past couple of years as the further back 5 years or more tell us very little about the potential for mean reversion. At the end of 2021, the HS actually was as wide as $180! Today it sits at $139 with April of 2022 it peaked at $161.39. What to do?


