When Days Feel like Years
Subscriber Note: In our daily WhatsApp broadcast Friday, we helped subscribers know the $GOOG estimate cut by M Science before the market opened and many were quite grateful. If these updates aren’t worth the $6 per month subscription then you should cancel your subscription now! In all seriousness, the proceeds from your subscription go to charity each year. I love writing this substack not only to help others but also it is therapeutic to put my thoughts on paper and consider all of the possibilities ahead. New paid subs send us your cell number for WhatsApp and we will add you to the daily list. Have a nice weekend and enjoy the read.
WHEN DAYS FEEL LIKE YEARS.
It used to be a “rule” that the stock market goes up on average 8% per year. These days we frequently see daily moves of 5% plus, making a day the equivalent to a year’s returns, given or taken away depending on position (long or short). That makes for a terrific environment for traders, right? Kinda yes, kinda no, depending on your strategy. This week we thought it might be helpful to take a step back and look at the big picture trend of the markets. Who “knows” this best? CTAs. There are hundreds of billions of dollars in CTA (Commodity Trading Advisor) strategies which trade all assets as a “commodity”, stocks, bonds and actual commodities like oil, wheat and orange juice. Think about the overall market in three buckets: 1) stock issuance, 2) stock buybacks and 3) incremental investment flows in and out. In general, stock buybacks dwarf issuance the past few years giving a general bid to the markets. The incremental equity mutual fund has been taking in capital as well. This is why the market tends to go up absent “pain” causing drawdowns. The CTAs exacerbate all of these moves by throwing lighter fuel on the direction that is trending (if it is trending at all).
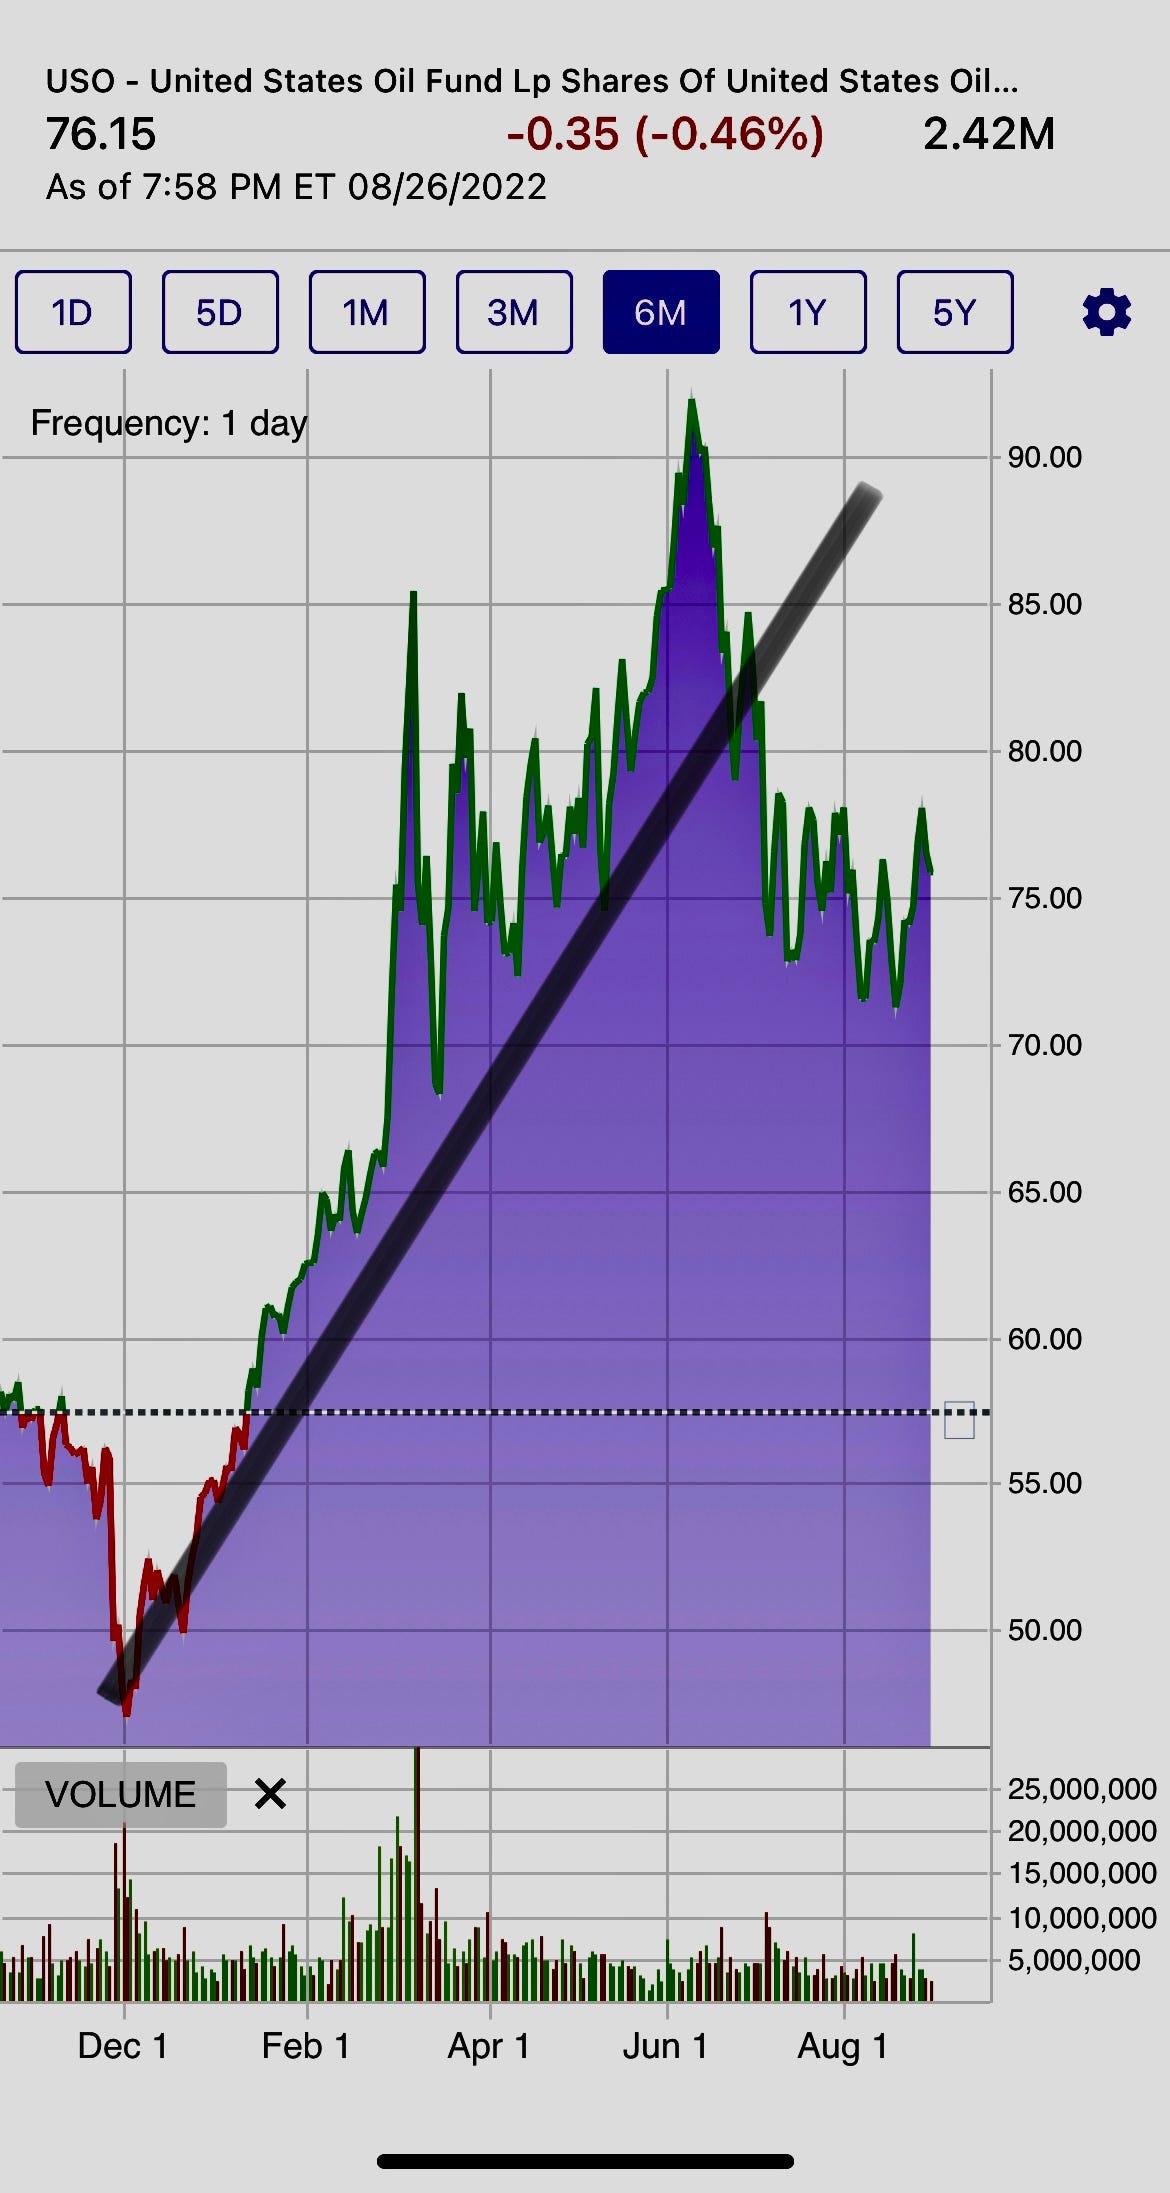
What does a CTA look at? This type of trader is a trend follower with models that show what is trending in a predictable fashion and they have stops when the trend breaks its pattern. We used the word trend three times in one sentence! That is all they look at! This year has been good to this group as major moves have lasted weeks and months and really have not been based largely on fundamental drivers. For example, oil and wheat went parabolic up on fears the Russian invasion would cut off supply to the world. From January 1st forward, oil basically didn’t downtick or cause any pain for traders for over three months. You could even draw the uptrend line (we did by hand below) and during the first major drawdown you still have held and kept your position really until the mid June break. You can see this was a terrific trend and very profitable for CTAs and trend followers.
The $SPY downtrend broke a week or two AFTER the low at $390 and continued to $420 earlier this month for a tidy 10% return without picking the bottom. Looking at the recent pullback it would appear the uptrend would be broken at around $400 for $SPY which would cause the gain to be about 3% $400/390, losing about 7% from their peak gain. Trend followers do not care. The 10% gain could have kept going like oil did making an emotional trader selling the first dip look silly. Remember their goal is to capture the entire move of the trend and cut when the trend changes, period. We did hear Friday that CTAs “have turned seller” in the markets. Perhaps some are front running the $400 break? I would imagine some models are marketed as “one step ahead” of the typical CTA model of when to sell, lowering overall volatility.


